HVAC Business Analytics
HVAC Job Costing Guide: The Complete 2026 Playbook for Contractors
HVAC job costing is the financial discipline that separates contractors who grow intentionally from those who stay busy and broke. Most HVAC contractors run their businesses on gut feel and hope — they win jobs, send invoices, and check the bank account to decide if it was a good month. But gut feel doesn't scale, and hope is not a financial strategy. This HVAC job costing guide walks through the formulas, the four cost categories, real worked examples, and the 2026 benchmarks that separate top-quartile shops from the 5%-net-margin median.
- What Is HVAC Job Costing?
- Why Most Contractors Are Flying Blind
- The Core Job Costing Formula
- Breaking Down the 4 Cost Categories
- A Real-World Job Costing Example
- Reading Your Job Costing Dashboard
- 2026 HVAC Job Costing Benchmarks
- 7 Job Costing Mistakes That Kill Margins
- How to Implement Job Costing in Your Business
- HVAC Job Costing FAQs
- The Bigger Picture: Job Costing as a Growth Strategy
- Work With Oryx Horn
#What Is HVAC Job Costing?
HVAC job costing is the process of tracking every dollar of cost and revenue associated with a specific job — from the moment a truck rolls to the moment the invoice is paid. It is the financial foundation that allows a contractor to answer three questions with precision:
Did I actually make money on that job? Which types of jobs are most profitable for my business? Which technicians are generating the most value per hour?
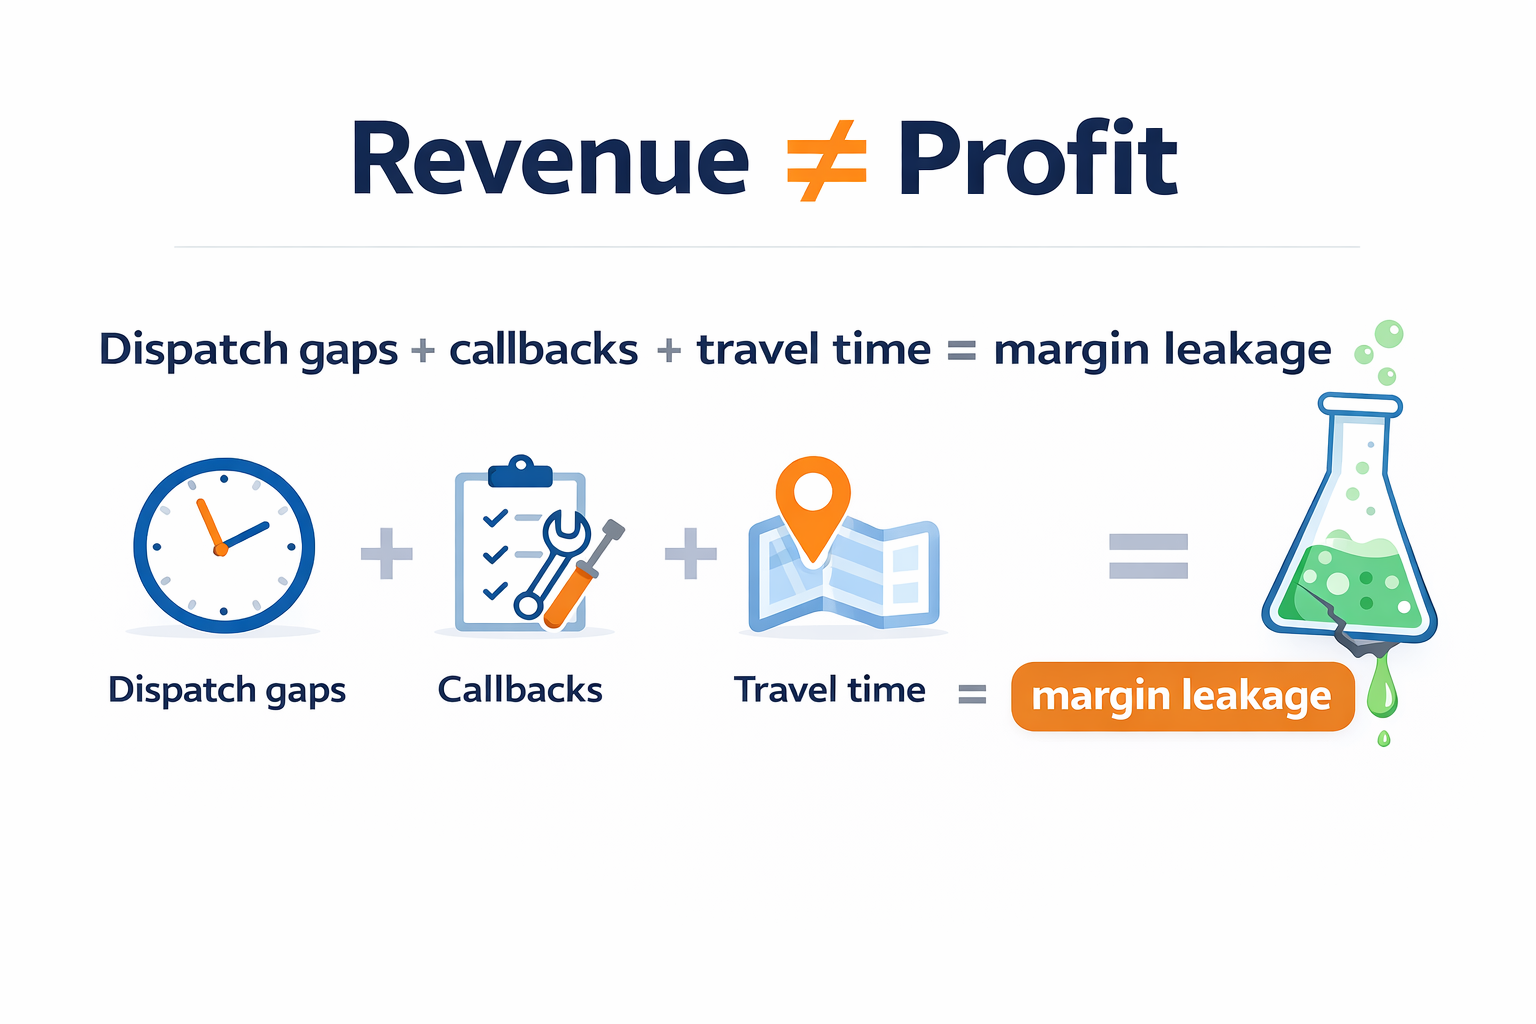
Without job costing, you know your total revenue. With job costing, you know your actual business. The distinction is everything.
Unlike generic bookkeeping — which tells you what happened at the company level — job costing operates at the job level, capturing direct labor hours, material costs, subcontractor fees, equipment usage, and overhead allocation for every individual ticket. The result is a profitability map of your entire operation: which job types, which technicians, which neighborhoods, and which service lines are actually driving your margins.
In industries where the top quartile of contractors operates at 15–20% net margin and the median operator barely clears 5%, job costing is the single most important analytical capability a contractor can build. For a working spreadsheet that implements every formula in this guide, see our Free HVAC Job Costing Template
#Why Most HVAC Contractors Are Flying Blind
In our work advising HVAC, plumbing, and electrical contractors, the pattern is remarkably consistent: owners know their revenue, they know their payroll cost, and they know their bank balance. What they do not know is which jobs are making them money and which are quietly destroying it.
The root cause is structural. Most HVAC contractors use field service management tools — ServiceTitan, Housecall Pro, Jobber — primarily as scheduling and invoicing software. They collect the data to do proper job costing but they never configure the reporting to surface it. The numbers sit dormant in the system while decisions get made on feel.
A second compounding problem is the treatment of overhead. Many contractors calculate job profit as revenue minus parts and labor. This is a vanity metric that excludes vehicle costs, insurance allocations, dispatch overhead, marketing cost-per-lead, and the owner's own time. The "profitable" $2,000 install job starts looking very different when you allocate $340 in overhead to it.
HVAC job costing forces honesty. It is the financial discipline that turns a contractor from an operator into a business owner. If you want to understand the specific pricing and margin mistakes driving this gap, we cover all seven in detail in Why HVAC Companies Aren't Profitable.
#The Core HVAC Job Costing Formula
Every HVAC job costing framework, regardless of complexity, begins with a single equation. Understand this at a cellular level and everything else follows logically.
Profit Per Hour is the single most important operational metric in HVAC job costing. It normalizes profitability across jobs of different sizes, durations, and types — allowing you to compare a 1-hour diagnostic call against a 3-day commercial install on equal footing. A business with a $500 average job profit sounds healthy; a business generating $180 profit per tech hour is demonstrably excellent.
Free — One Email Per Month
Get the HVAC Margin Brief
One short email per month for $1M–$15M HVAC owners: a fresh benchmark, a teardown of a real shop's job costing data, or a margin lever we've helped a client pull. No fluff, no pitch. Unsubscribe anytime.
HVAC Job Costing Calculator
Drop in one job's numbers. We'll show you the true cost, your actual net margin, and what you should have charged to hit your target.
Your Job Breakdown
- True Job Cost—
- Actual Net Profit—
- Actual Net Margin—
- Price Floor (to hit target)—
- Gap vs. Price Floor—
Want this saved + emailed to you as a PDF report? Drop your email and we'll send it.
Saved — we'll send your report shortly.
#Breaking Down the 4 Cost Categories
01 — Direct Labor
Direct labor is the fully-loaded cost of your technician's time on a specific job. The critical word is fully-loaded — this means not just the hourly wage, but the total employment cost including payroll taxes (approximately 7.65% employer FICA), workers' compensation insurance (typically 4–12% of wages in the trades), health benefits, and any paid time off. Many contractors undercount labor by 30–40% by omitting these components.
A technician earning $28/hr with benefits, taxes, and comp included often costs the business $38–44/hr fully loaded. Using $28 as your labor cost will overstate your job margins by double digits. The Bureau of Labor Statistics tracks HVAC technician compensation benchmarks that can serve as a useful reference when modeling your labor cost structure.
02 — Materials & Parts
Material cost is the invoice cost of all parts, refrigerant, equipment, and supplies consumed on the job. In HVAC job costing, best practice is to capture this at the job level via PO matching or your field service management platform's inventory module. Material cost should reflect your actual net cost — after supplier discounts and rebates — not the price you pay on a rush trip to the supply house.
Target material markup in residential HVAC typically runs 25–40% depending on job type. Your markup should be calibrated to recover not just the cost of goods, but the carrying cost of inventory, the cost of waste and returns, and an appropriate margin contribution.
03 — Subcontractors & Outside Services
Any work performed by a third party — electrical permits handled by a licensed sub, crane services for rooftop units, sheet metal fabrication — is a direct cost against the job. These are frequently undertracked in HVAC job costing because they appear on separate invoices that arrive weeks after job completion. A rigorous HVAC job costing system holds jobs open until all associated vendor invoices are reconciled.
04 — Allocated Overhead
This is where most HVAC job costing systems break down. Overhead — rent, vehicle costs, insurance, dispatch and admin salaries, software, marketing — is a real cost of doing business that must be assigned to individual jobs. The most common allocation method in the trades is a labor-hour allocation rate, consistent with guidelines from the Air Conditioning Contractors of America (ACCA) for sound financial management:
Example: $480,000 overhead ÷ 8,000 billable hours = $60/hr overhead rate
A job requiring 4 technician hours then carries $240 in overhead. This is not optional accounting — it is the only way to understand true job-level economics.
#A Real-World HVAC Job Costing Example
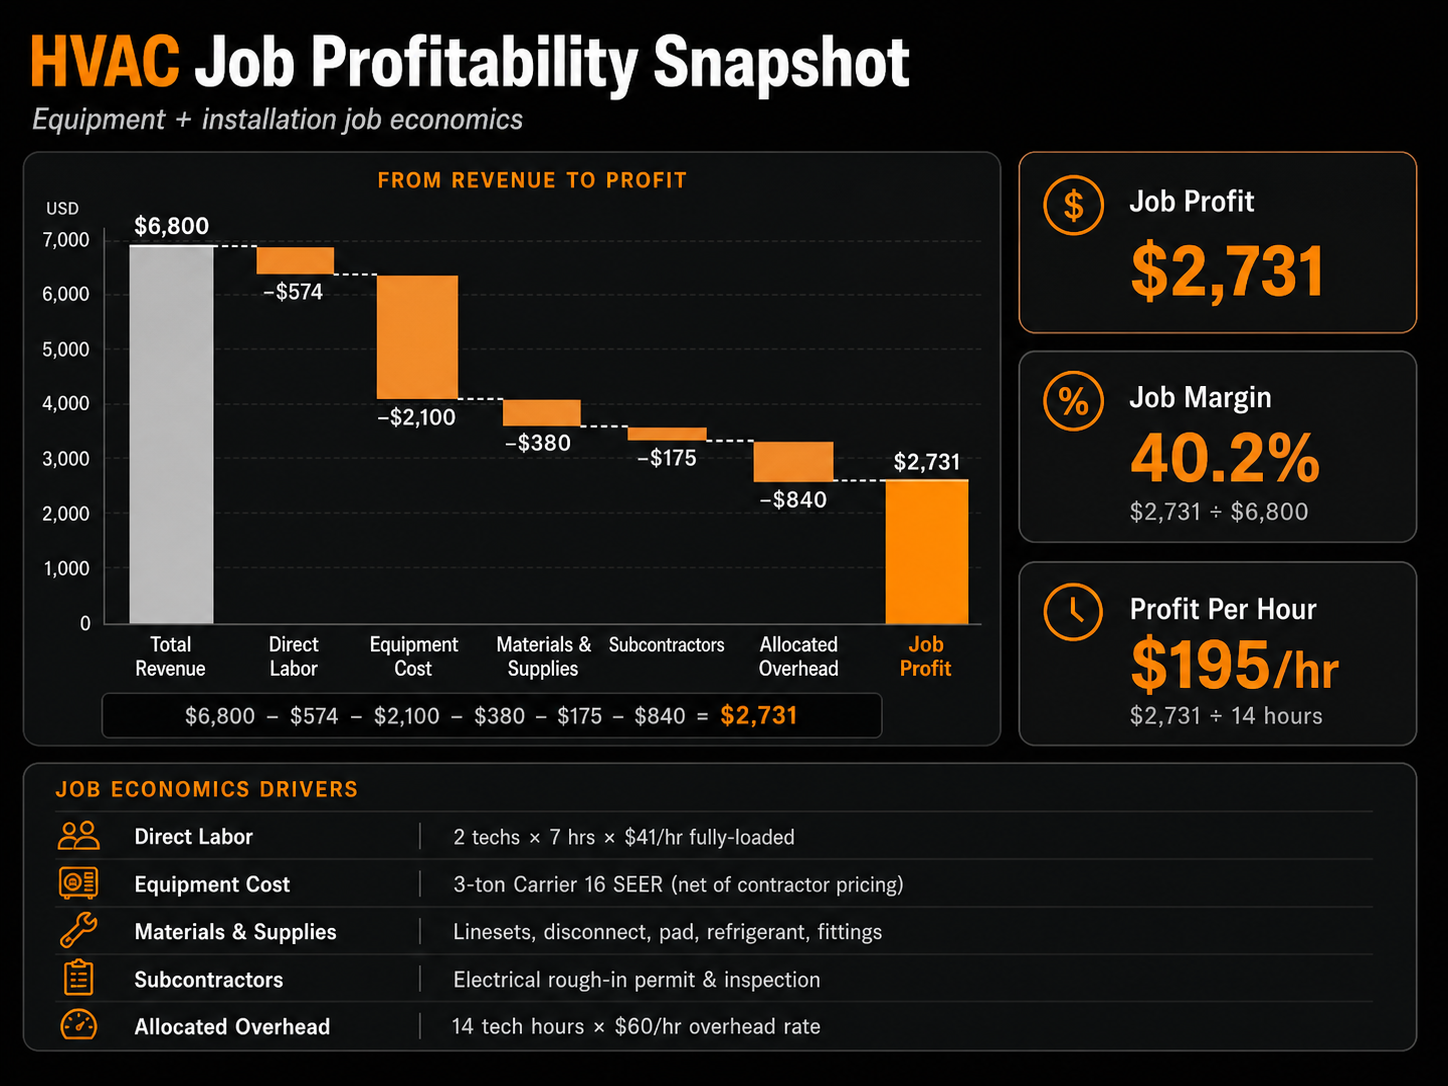
Let's walk through a complete example: a residential split-system replacement, 3-ton Carrier unit, two technicians, completed in a single day.
| Line Item | Detail | Amount |
|---|---|---|
| Total Revenue | Customer invoice — equipment + installation | $6,800 |
| Direct Labor | 2 techs × 7 hrs × $41/hr fully-loaded | −$574 |
| Equipment Cost | 3-ton Carrier 16 SEER (net of contractor pricing) | −$2,100 |
| Materials & Supplies | Linesets, disconnect, pad, refrigerant, fittings | −$380 |
| Subcontractors | Electrical rough-in permit & inspection | −$175 |
| Allocated Overhead | 14 tech hours × $60/hr overhead rate | −$840 |
| Job Profit | +$2,731 | |
| Job Margin | $2,731 ÷ $6,800 | 40.2% |
| Profit Per Hour | $2,731 ÷ 14 hours | $195/hr |
This is a strong-performing install job. A 40% margin and $195/hr profit rate both sit above industry average for residential replacement. Now compare it against a service call that generates $350 in revenue for one technician hour — a job that looks small but may yield $180+ in profit per hour after a $90 overhead allocation. Proper HVAC job costing allows you to understand both numbers and optimize your job mix, not just your total revenue. For a deeper look at how to structure and price service calls to maximize that margin, see our guide on service call fee pricing strategies.
#Reading Your HVAC Job Costing Dashboard
The most powerful shift in modern HVAC financial management is the move from monthly financial reviews to real-time HVAC job costing dashboards. When your data is configured correctly in ServiceTitan or a connected BI layer, you can see the following HVAC job costing metrics updated daily — and act on them before the month closes.
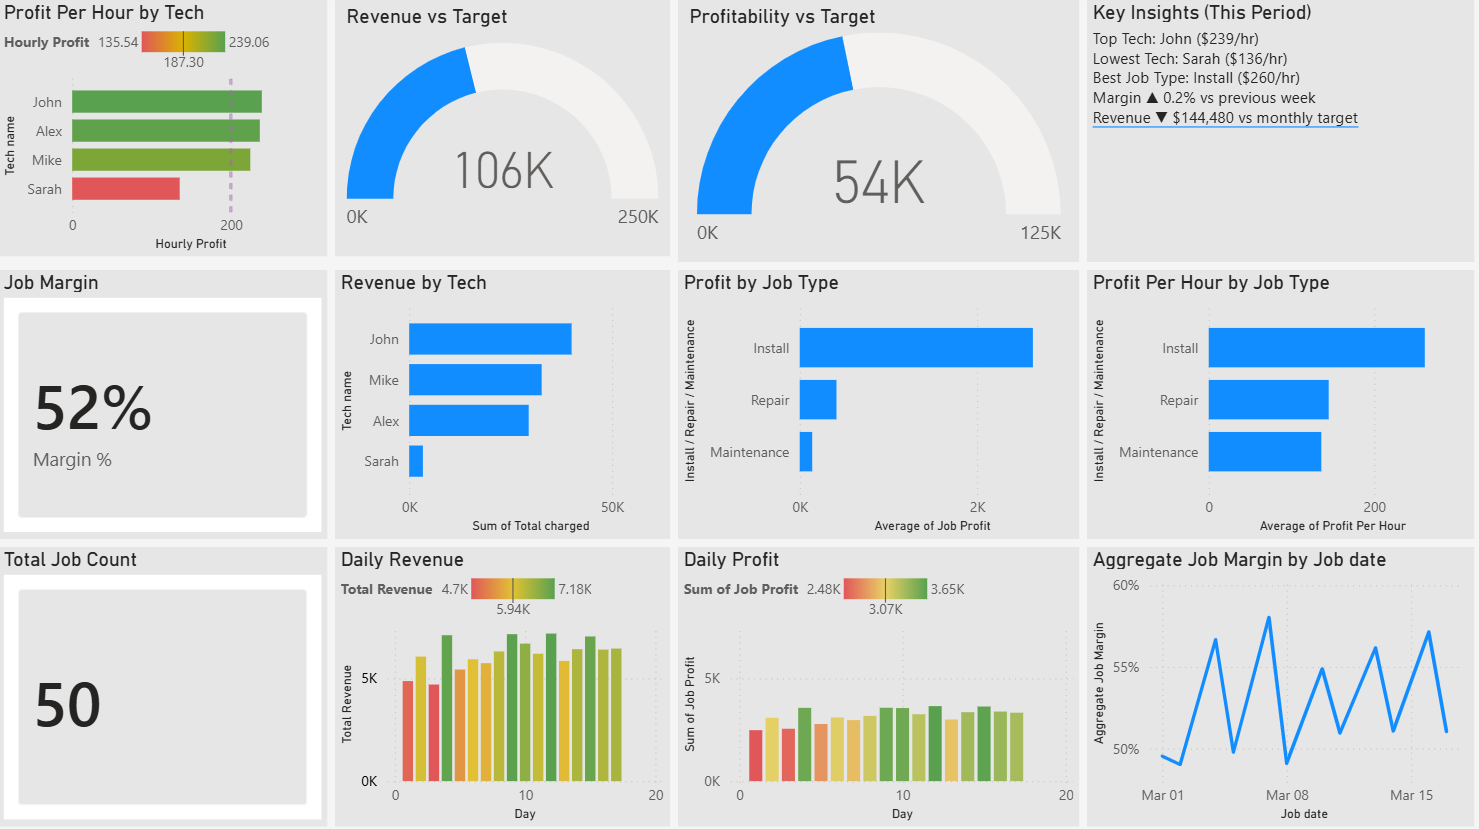
Dashboard data illustrating real-time job costing metrics across technician performance, job type profitability, and period targets. Profit Per Hour by technician and job type are the two leading indicators to monitor weekly.
A well-built HVAC job costing dashboard surfaces four diagnostic views simultaneously:
View 1 — Profit Per Hour by Technician
This is your single most actionable performance metric. In the dashboard above, the spread between the top technician ($239/hr) and the bottom ($136/hr) represents a $103/hr differential in value creation. Across 2,000 billable hours per year, that's a $206,000 annualized gap — between employees at nominally similar pay grades. The question this raises is not "how do we fire Sarah" but "what is John doing on jobs that Sarah is not?" Are install callbacks dragging her effective hours up? Is she running a disproportionate share of warranty calls?
View 2 — Profit by Job Type
In the data shown, Install jobs generate the highest absolute profit and the highest profit per hour. Maintenance sits meaningfully below repair. This has direct implications for your sales and dispatch strategy: are you converting maintenance agreement customers to install opportunities at the right rate? If maintenance is your acquisition channel and install is your monetization event, the funnel math needs to be explicit.
View 3 — Revenue vs Target & Profitability vs Target
Period-to-target gauges give you variance, not just absolute performance. In the example above, the business is at $106K revenue against a $250K monthly target — a significant gap that warrants a closer look at lead volume, conversion rates, and job capacity. A dashboard without targets is a scoreboard without a game.
View 4 — Daily Revenue & Margin Trend
The daily revenue and daily profit charts reveal intra-period patterns that a monthly P&L will never surface. Early-month softness followed by a late-month surge may look fine on a monthly summary but signals a scheduling and pipeline problem that will eventually become a cash flow problem. Aggregate job margin by date lets you see if your margin is stable, compressing, or improving as the period matures.
#2026 HVAC Job Costing Benchmarks
Benchmarks are only useful when they are specific. The following targets reflect residential HVAC contractors operating in competitive U.S. markets with a mixed service, repair, and install book. Contractors running primarily commercial or new construction work will see different norms. Industry associations such as HARDI publish annual distributor and contractor data that can supplement your internal HVAC job costing benchmarking.
HVAC Revenue Per Technician Benchmark (and Why It Matters Most)
Of the eight metrics below, HVAC revenue per technician is the single most predictive of overall business health. Top-quartile residential shops generate $250K+ per technician annually; the median sits closer to $200K. The gap is rarely about effort — it's about job mix, dispatch efficiency, and pricing discipline. The full benchmark set:
| Metric | Below Average | Average | Top Quartile |
|---|---|---|---|
| Overall Job Margin | < 35% | 35–50% | 50–65% |
| Profit Per Tech Hour | < $100/hr | $100–160/hr | $160–250/hr |
| Install Job Margin | < 38% | 38–52% | 52–68% |
| Service/Repair Margin | < 45% | 45–60% | 60–75% |
| Maintenance Margin | < 30% | 30–45% | 45–60% |
| Material Markup | < 20% | 20–35% | 35–50% |
| Overhead as % of Revenue | > 45% | 30–45% | < 30% |
| Revenue Per Tech (Annual) | < $180K | $180–250K | > $250K |
What Is a Good HVAC Profit Margin in 2026?
The average HVAC profit margin in 2026 sits at roughly 5% net at the company level for the median operator, with top-quartile shops achieving 15–20% net margin. At the job level, a good HVAC profit margin is 50%+ on installs and 60%+ on service work after fully-loaded labor and properly allocated overhead. If your reported job margins look much higher than these ranges, you are almost certainly understating labor cost or omitting overhead allocation — both common HVAC job costing errors covered in the next section. For a deeper benchmark by shop size and trade mix, see our average HVAC profit margin guide.
If your current reporting isn't surfacing these metrics, see how our HVAC BI dashboard is configured to track profit per hour and job margin in real time.
The 52% job margin in the dashboard example above sits at the entry point of the top quartile — a genuinely strong result. The $187 average profit per tech hour also tracks above average, though the spread between technicians suggests there is meaningful upside available through coaching and better job assignment.
#7 Job Costing Mistakes That Kill HVAC Margins
-
01
Using Wage Rate Instead of Fully-Loaded Labor Cost
Your $28/hr technician costs you $38–44/hr when you include taxes, workers' comp, and benefits. Using the wage rate inflates job margin by 10–15 percentage points and systematically understates your true cost structure. This is the single most common job costing error in the trades.
-
02
Not Allocating Overhead to Jobs
Vehicle costs, insurance, admin salaries, and software are real operating expenses. A business with $480K in annual overhead and 8,000 billable hours carries $60 per tech hour in overhead that must be assigned to jobs. Ignoring this creates false confidence in your job-level economics.
-
03
Closing Jobs Before All Costs Are In
Subcontractor invoices, permit fees, and equipment credits often arrive 2–4 weeks after job completion. Closing the job at invoice creates a materially understated cost record. Best practice is to hold jobs open for 30 days or until all associated payables are reconciled.
-
04
Measuring Revenue Per Tech Instead of Profit Per Hour
A technician generating $60K in monthly revenue on high-material, low-margin install work may be creating less value than a tech doing $35K in high-margin service calls. Revenue per tech is a useful throughput metric. Profit per hour is the profitability metric. Optimize for the latter.
-
05
Treating All Job Types the Same in Pricing
Maintenance, repair, and installation carry different overhead intensities, different material profiles, and different time-on-site dynamics. Applying a uniform markup to all job types means you are systematically underpricing some work and potentially overpricing others. Job type-specific pricing models are the solution.
-
06
Not Tracking Callbacks as a Cost Against Original Jobs
A callback is a cost: labor hours, vehicle operating cost, and parts — often with no revenue. A job that looks like it generated $800 in profit on first completion may have actually generated $450 after a two-hour callback is properly costed. Callback rate by technician is a quality and profitability KPI, not just an operations metric. Building the systems that prevent repeat visits in the first place is a core component of operational discipline for home services companies.
-
07
Reviewing Job Costing Data Monthly Instead of Weekly
Monthly job costing reviews are autopsies. By the time you identify that technician pricing exceptions eroded March margins, March is over. Weekly job costing dashboards — even a simple Profit Per Hour by tech view — allow you to course-correct in real time, before the damage compounds.
#How to Implement Job Costing in Your HVAC Business
For most contractors, the data required for job costing already exists inside their field service management platform. The gap is not data collection — it is configuration, discipline, and reporting. Here is the implementation sequence we use with clients:
-
Calculate Your Fully-Loaded Labor Rate for Every Tech
Pull your last 12 months of payroll data. Add employer taxes (7.65%), workers' comp (check your policy rate), and benefits. Divide by actual billable hours (not clock hours). This number is your true cost per tech hour and it should be reviewed annually and whenever you give raises.
-
Calculate Your Overhead Allocation Rate
Pull your trailing 12-month P&L. Identify all costs that are NOT direct labor or direct materials — this is your overhead bucket. Divide by your total annual billable tech hours. Update this quarterly. It is common for this number to shift materially as you add headcount or vehicles.
-
Configure Job Type Costing in Your FSM Platform
Most ServiceTitan, Jobber, and Housecall Pro implementations use generic job types. Create distinct job type categories — Install, Repair, Maintenance, Commercial Service — and configure your reporting to break down cost and profitability at the job type level. This is the architecture that makes segmented analysis possible.
-
Establish a Job Closing Protocol
Define a written process for when and how jobs get closed. Include a checklist: all labor hours entered, all parts invoiced, all subcontractor costs matched to POs, any callbacks logged against the original job. Assign this to a dispatcher or office manager, not to the technicians themselves.
-
Build Your Weekly Reporting Cadence
At minimum, review Profit Per Hour by technician and Job Margin by job type on a weekly basis. These two views will surface 80% of the problems and opportunities in your job costing data. If you are using a BI layer connected to your FSM platform, configure automated alerts when individual job margins fall below your floor threshold. If you're not on a BI layer yet, our HVAC Job Costing Template gives you a working spreadsheet version of the dashboard above — the same Profit Per Hour and Job Margin views, in Excel or Google Sheets.
-
Set Job-Level Targets and Hold Reviews
Job costing data without targets is observation without management. Set minimum acceptable margins by job type — for example, 40% floor on installs, 55% floor on service calls. Review any jobs that fall below the floor in your weekly meeting. The goal is not punishment; it is pattern recognition: are below-floor jobs clustered by technician, geography, equipment brand, or job source?
-
Connect Job Costing to Your Pricing Model
The ultimate purpose of job costing is better pricing. As you accumulate historical job-level data, you gain the empirical foundation to build cost-plus pricing that reflects actual field economics rather than competitive guessing. This is the transition from reactive to strategic pricing — and it is one of the most durable competitive advantages an HVAC contractor can build. For the step-by-step pricing methodology, see our guide on how to price HVAC jobs.
The Bigger Picture: Job Costing as a Growth Strategy
HVAC contractors who implement rigorous job costing do not just improve their margins — they change the nature of how they run their businesses. They stop taking every job and start being selective about job mix. They stop guessing at pricing and start building empirically-grounded rate structures. They stop managing technicians by revenue and start developing them against profit-per-hour targets that make compensation conversations straightforward. For a broader view of the catalysts that drive this kind of growth, see our guide on home services business growth for HVAC and trades contractors.
At scale, job costing becomes the foundation for every major strategic decision: whether to add another truck, which neighborhoods to target for install campaigns, whether a new service line is actually profitable, and what the business is worth if you ever want to sell it. Private equity acquirers in the home services space — and there are many — pay premium multiples for businesses with clean, auditable job costing histories. It is not just a reporting capability; it is an asset.
The contractors who build this infrastructure early — before they need it to solve a crisis — are the ones who find themselves in the top quartile of the benchmarks above. The ones who wait until margins are bleeding often find the diagnosis comes too late to avoid painful operational changes.
Job costing is not accounting. It is strategy with numbers attached.
#HVAC Job Costing FAQs
What is a good HVAC profit margin in 2026?
At the company level, top-quartile HVAC contractors run 15–20% net margin while the median operator clears around 5%. At the job level, a good HVAC profit margin is 50%+ on installs, 60%+ on service and repair work, and 45%+ on maintenance — after fully-loaded labor and properly allocated overhead. Margins much higher than these ranges usually mean labor or overhead is being understated.
How do you calculate HVAC labor cost per hour?
Fully-loaded HVAC labor cost is calculated as (Annual Wages + Payroll Taxes + Benefits + Workers' Comp) ÷ Billable Hours. A technician earning $28/hr in wages typically costs the business $38–44/hr fully loaded once you include the 7.65% employer FICA, workers' comp (4–12% of wages), and benefits. Using the wage rate alone overstates job margins by 10–15 percentage points.
What is the average HVAC revenue per technician?
Average HVAC revenue per technician in 2026 ranges from $180K–$250K annually for residential contractors, with top-quartile shops generating over $250K per tech. Revenue per technician is one of the most predictive HVAC benchmarks because it normalizes for shop size and reveals dispatch efficiency, job mix, and pricing discipline simultaneously.
Are HVAC companies profitable?
Yes, but with significant variance. The top quartile of HVAC contractors operates at 15–20% net margin while the median operator clears roughly 5%. Profitability is driven less by revenue scale and more by job-level economics: install vs. service mix, fully-loaded labor cost, callback rate, and overhead discipline. Many $2M HVAC shops are less profitable than $900K shops with a stronger job mix.
What's the right markup for HVAC parts and materials?
Target material markup in residential HVAC typically runs 25–40%, with top-quartile shops achieving 35–50%. Markup should be calibrated to recover not just the cost of goods but also inventory carrying cost, waste and returns, and a margin contribution above your fully-loaded labor recovery. Different job types — install vs. service vs. maintenance — should carry different markup profiles.
How do I price an HVAC job profitably?
Profitable HVAC pricing starts with three inputs: fully-loaded labor cost per hour, your overhead allocation rate per hour, and target margin by job type. The formula is: Price = (Labor Hours × (Loaded Labor + Overhead Rate)) + (Materials × (1 + Markup)) + Subcontractors, divided by (1 − Target Margin). For a step-by-step pricing walkthrough with examples, see our guide on how to price HVAC jobs.
What software is best for HVAC job costing?
ServiceTitan has the most robust job costing infrastructure on the market, but the default configuration underutilizes it. Housecall Pro, Jobber, and FieldEdge can all support basic HVAC job costing with proper setup. The platform matters less than the configuration — every major FSM tool requires custom job types, correct pricebook cost inputs, overhead fields, and a connected reporting layer to surface Profit Per Hour and Job Margin in real time.
How often should I review job costing data?
Weekly, at minimum. Monthly job costing reviews are autopsies — by the time you identify pricing exceptions or labor inefficiencies that eroded last month's margins, the month is closed and the damage is done. A weekly Profit Per Hour by technician and Job Margin by job type review surfaces 80% of problems while you can still act on them.
Got a Job Costing Question?
Ask Us — We'll Give You a Straight Answer
Specific to your software, your job types, your situation. No pitch. Tatenda replies personally within one business day.
See What Your Jobs Are Actually Worth
Oryx Horn LLC builds custom job costing dashboards and financial analytics systems for HVAC, plumbing, and electrical contractors. If your data exists but your reporting doesn't surface it, we can fix that — typically within 30 days.
Talk to an Analyst →