HVAC Business Analytics
Average HVAC Profit Margin in 2026 (Real Benchmarks by Shop Size and Trade Mix)
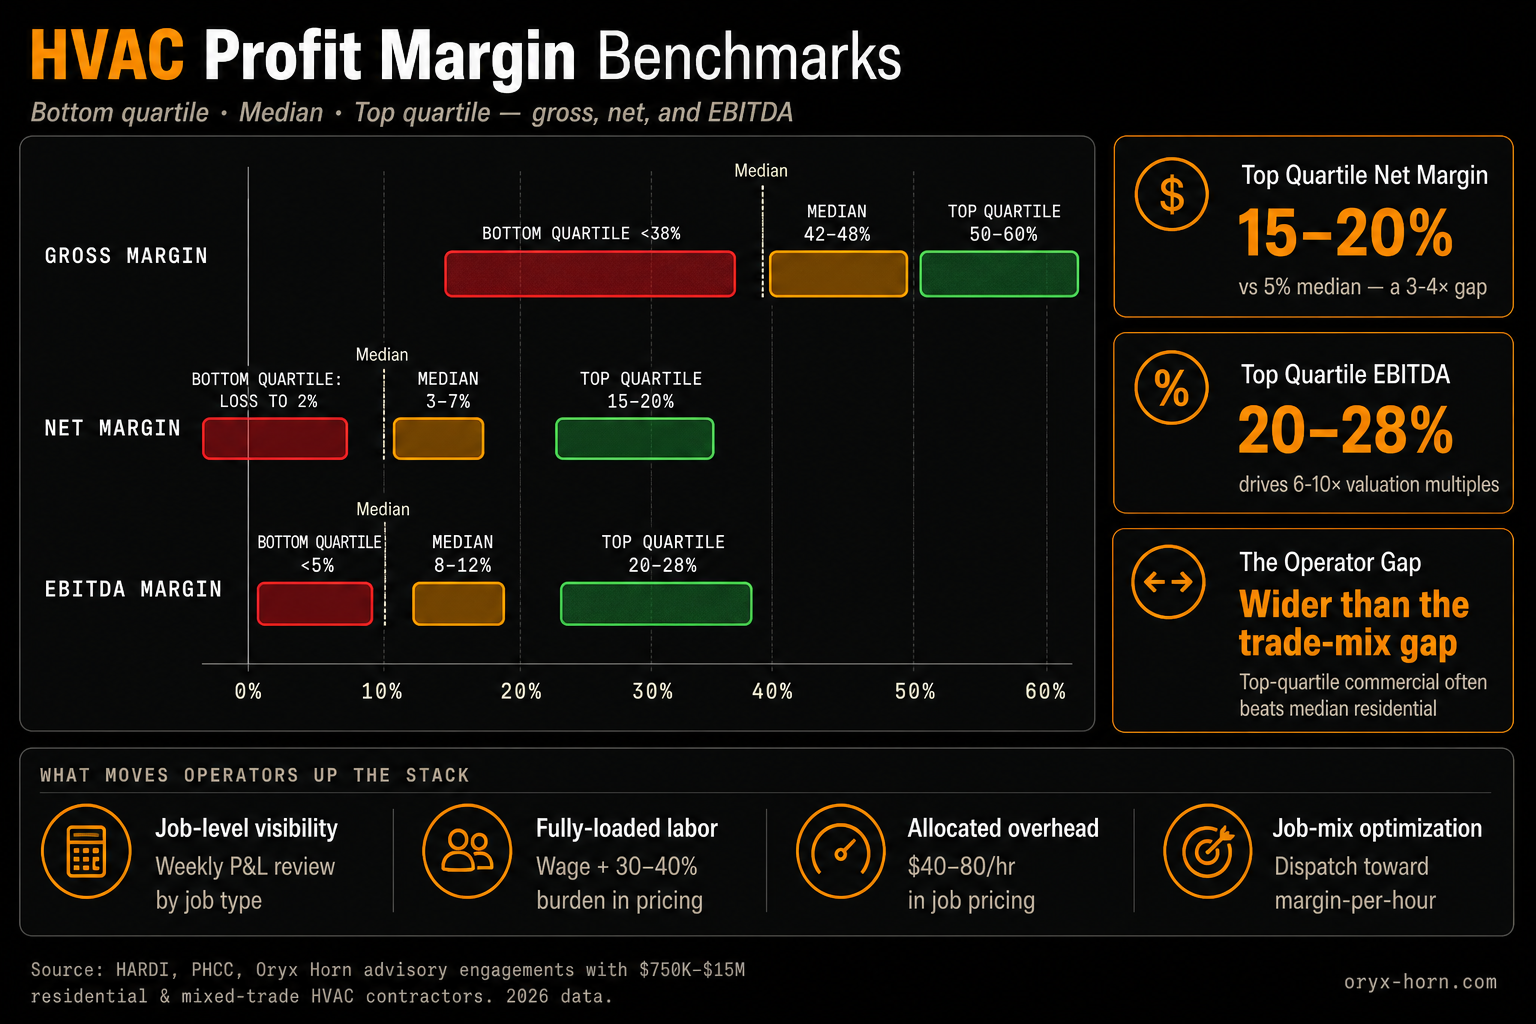
The average HVAC profit margin in 2026 is roughly 5% net for the median operator and 15–20% net for top-quartile contractors. Gross margins run 42–48% (median) vs 50–60% (top quartile); EBITDA runs 8–12% vs 20–28%. Operating discipline drives the gap more than trade mix or shop size.
The gap between median and top quartile is consistently larger than the gap between residential vs commercial, service vs install, or small vs large shops. What separates a 5% shop from a 20% shop is not the kind of HVAC work they do — it's how tightly they run the back office.
This guide breaks down the average HVAC profit margin by shop size, trade mix, and margin type, with the calculation methodology behind each number.
- What Is a Good HVAC Profit Margin in 2026?
- Average HVAC Profit Margin: The 2026 Numbers
- HVAC Profit Margin by Shop Size
- HVAC Profit Margin by Trade Mix
- Top Quartile vs Median — Why the Gap Is Large
- Job-Level vs Company-Level Profit Margin
- How HVAC Profit Margin Is Calculated
- HVAC Profit Margin Trends (2021–2026)
- How to Improve Your HVAC Profit Margin
- HVAC Profit Margin FAQs
#What Is a Good HVAC Profit Margin in 2026?
A good HVAC profit margin in 2026 is 15–20% net, 50%+ gross, and 20%+ EBITDA at the company level for residential contractors operating in the $750K–$15M revenue band. These ranges define the top quartile of the industry. The median HVAC operator runs roughly 5% net margin — a level that often feels like "doing fine" on a monthly P&L but represents a thin cushion against any operational shock.
At the job level, a good HVAC profit margin looks different: 50%+ on installs, 60%+ on service and repair work, and 45%+ on maintenance — measured after fully-loaded labor and properly allocated overhead. Margins that look much higher than these ranges almost always mean labor or overhead is being understated. We cover the calculation discipline in detail in our HVAC job costing guide.
Top quartile: 15–20% net · 50–60% gross · 20–28% EBITDA
#Average HVAC Profit Margin: The 2026 Numbers
Three margin metrics matter for an HVAC contractor and they answer different questions. Gross margin measures pricing and cost-of-goods discipline. Net margin measures total business efficiency after every expense including overhead and owner compensation. EBITDA margin measures the operational profitability of the business as an asset — the metric a private equity acquirer or bank uses when valuing the company.
| Margin Metric | Median Operator | Top Quartile | Bottom Quartile |
|---|---|---|---|
| Gross Margin | 42–48% | 50–60% | < 38% |
| Net Margin | 3–7% | 15–20% | Loss to 2% |
| EBITDA Margin | 8–12% | 20–28% | < 5% |
These ranges are synthesized from publicly available industry data — including HARDI annual distributor and contractor reports and PHCC contractor surveys — and our own advisory engagements with $750K–$15M residential and mixed-trade contractors. Regional variance is meaningful: contractors in higher-cost-of-living markets typically run 1–3 points higher net margin due to pricing power, while contractors in fully commoditized markets compress to the lower end of the ranges.
#HVAC Profit Margin by Shop Size
HVAC profit margin does not scale linearly with revenue. The smallest shops carry overhead drag relative to their revenue base; the mid-market shops ($1.5M–$3M) often hit the sweet spot for owner-operators where overhead is amortized but the business has not yet entered the management-layer transition; the $3M–$5M band frequently shows margin compression as the business adds office staff but has not yet captured operational scale.
| Annual Revenue | Median Net Margin | Top-Quartile Net Margin | Common Pattern |
|---|---|---|---|
| Under $750K | 3–7% | 10–15% | Owner-operator, overhead drag |
| $750K – $1.5M | 6–10% | 14–18% | 2–3 trucks, dispatch emerging |
| $1.5M – $3M | 8–13% | 16–22% | Owner-operator sweet spot |
| $3M – $5M | 7–11% | 15–20% | Management transition pain |
| $5M – $10M | 8–13% | 17–23% | Operational scale benefits |
| $10M – $15M | 9–14% | 18–25% | Pre-PE professionalization |
The dip at $3M–$5M is one of the most consistent patterns in the data. Owners hit this band, hire their first office manager and dispatcher, take a personal step back from technical work — and watch margin compress as their direct revenue contribution drops faster than the new hires create leverage. Top-quartile operators in this band have invariably solved the management-layer transition with rigorous job costing and KPI dashboards before adding overhead headcount, not after.
#HVAC Profit Margin by Trade Mix
Trade mix is the second most predictive variable in HVAC profit margin after operational discipline. Service and repair work carries higher gross margin than installation work because labor productivity per dollar of revenue is higher and material content is lower as a percentage of price. Commercial-focused contractors typically run lower margins than residential due to competitive bidding processes, longer payment cycles, and commercial pricing pressure.
| Trade Mix Profile | Gross Margin | Net Margin | EBITDA Margin |
|---|---|---|---|
| Residential service-heavy 60%+ revenue from service/repair |
50–58% | 8–15% | 12–20% |
| Residential install-heavy 60%+ revenue from new installs |
38–46% | 5–10% | 8–15% |
| Mixed residential balanced service + install |
42–50% | 6–12% | 10–17% |
| Commercial-focused 60%+ revenue from commercial |
32–42% | 4–9% | 7–13% |
| Multi-trade HVAC + plumbing + electrical |
42–48% | 7–12% | 11–18% |
The 8–15 point gross margin gap between service-heavy and install-heavy operators is the single biggest mix-driven variance in HVAC profit margin. Owners who optimize their dispatch, marketing spend, and technician training toward service revenue typically capture meaningfully more profit per dollar of revenue than peers chasing larger install ticket sizes. This is one of the foundational insights behind why most HVAC companies aren't profitable despite being fully booked — the work mix is wrong.
#Top Quartile vs Median — Why the Gap Is Large
The most consistent finding across HVAC profit margin data is that the gap between segment median and segment top-quartile is larger than the gap between segments. A top-quartile commercial-focused contractor often outperforms a median residential service-heavy operator on net margin. The segment matters; operating discipline matters more.
Four factors separate top-quartile HVAC operators from the median in 2026:
-
Job-level visibility, not just monthly P&L
Top-quartile shops review profitability at the job level weekly, comparing actuals to job-type targets. Median shops review monthly company P&Ls and are blindsided by which jobs are dragging them down.
-
Fully-loaded labor cost in pricing
Top-quartile operators price using fully-loaded labor (wage + payroll taxes + workers' comp + benefits, typically 30–40% above wage). Median operators use wage rate, inflating apparent margins by 10–15 points and systematically underpricing.
-
Allocated overhead in job pricing
Top-quartile operators assign overhead per technician hour ($40–$80/hr typically) when pricing jobs. Median operators ignore overhead allocation, treating all gross profit as net — a category error that compounds across thousands of jobs per year.
-
Job-mix optimization, not revenue optimization
Top-quartile operators dispatch and market toward high-margin-per-hour work. Median operators take whatever calls come in and grow whatever job types fill the calendar — including the low-margin work that erodes profitability.
The gap is fixable, and none of the four factors require new software or new hires. They require configuring existing field service management tools — ServiceTitan, Housecall Pro, Jobber — to surface the right reporting, and the operating discipline to act on what the reports show.
Where Does Your Shop Stand?
Drop in your annual numbers and we'll show you your gross + net margin, your trade-mix benchmark range, and how big the gap is to top-quartile.
Your Margin Snapshot
- Gross margin—
- Net margin—
- Trade-mix typical range—
- Top-quartile threshold15%+
- Gap to top quartile—
Want the full report emailed to you? Drop your email — we'll send the detailed margin breakdown with specific levers for your trade mix and shop size.
Saved — your report is on its way.
#Job-Level vs Company-Level Profit Margin
The two most useful margin metrics in HVAC live at different levels of the business. Company-level margins (gross, net, EBITDA) measure the business as a whole — useful for benchmarking against peers, valuation, and bank financing. Job-level margins measure individual job profitability — useful for pricing, dispatch, technician performance, and identifying which jobs are dragging the business down.
| Margin Type | What It Measures | Top-Quartile Target |
|---|---|---|
| Company Gross Margin | Pricing & COGS discipline across all work | 50%+ |
| Company Net Margin | Total efficiency after every cost | 15–20% |
| Company EBITDA | Operational profitability for valuation | 20–28% |
| Install Job Margin | Profit per install after fully-loaded costs | 50%+ |
| Service Job Margin | Profit per service call after costs | 60%+ |
| Maintenance Job Margin | Profit per maintenance visit after costs | 45%+ |
| Profit Per Tech Hour | Profitability normalized for labor time | $160+/hr |
Company-level margins lag — by the time the monthly P&L closes, last month's mistakes are baked in. Job-level margins lead — they tell you within days whether last week's pricing exceptions or technician callbacks are eroding profitability before the damage compounds. Top-quartile HVAC operators monitor both. For the calculation framework at the job level, see our HVAC job costing guide.
#How HVAC Profit Margin Is Calculated
Each margin metric uses a specific formula. Calculating them correctly requires clean accounting categorization at the company level and rigorous job costing at the job level.
COGS = Direct Labor + Materials + Subcontractors + Equipment
Net Income = Revenue − COGS − Operating Expenses − Interest − Taxes
EBITDA = Net Income + Interest + Taxes + Depreciation + Amortization
A clean worked example: an HVAC contractor generates $3,000,000 in annual revenue. COGS totals $1,560,000 (52% of revenue). Operating expenses including owner compensation total $1,180,000. Interest is $20,000 and taxes are $50,000. Net income is $190,000 — a net margin of 6.3%. Adding back $20,000 interest, $50,000 taxes, and $80,000 depreciation produces EBITDA of $340,000 — an EBITDA margin of 11.3%. Both numbers sit at the median for a $3M shop.
#HVAC Profit Margin Trends (2021–2026)
HVAC profit margins compressed meaningfully in the 2021–2023 period as wage inflation, parts cost increases, and supply chain disruptions outpaced contractor pricing adjustments. Median net margin in residential HVAC fell from approximately 7% in 2020 to 4% in 2023 — a 3-point compression that translated to material impact on owner take-home for shops in the $750K–$3M band.
The 2024–2025 period saw partial recovery as contractors caught pricing up to costs and demand softened slightly, allowing more selective job-taking. Median net margin recovered to approximately 5% by mid-2025. The gap between top-quartile and median operators widened during this period — top-quartile operators were faster to adjust pricing, more disciplined about job mix, and more aggressive about technician utilization, capturing margin recovery faster than the median.
The 2026 environment is comparatively stable. Wage inflation has moderated to 3–4% annually. Parts costs are flat. Equipment costs are stable. Margin pressure now comes primarily from competitive intensity in install pricing and continued wage cost growth in technician labor markets. The operators winning in 2026 are doing it through operational discipline, not market tailwinds.
#How to Improve Your HVAC Profit Margin
Improving HVAC profit margin in 2026 is an operational exercise, not a market-conditions exercise. Five levers consistently produce 3–7 points of net margin recovery over a 12-month implementation:
-
Implement job-level costing with fully-loaded labor and overhead allocation
Eliminate the wage-rate trap and ensure every job carries its share of overhead. This single change typically reveals 4–7 points of margin that were never there to begin with. See the HVAC job costing guide for the formulas and a free template.
-
Track callback rate by technician and job type
A 4% callback rate on $2M revenue erodes $40K–$80K in unbilled labor and parts annually. Most owners can't pull the number on demand. Until you can, you can't fix it.
-
Re-price maintenance plans against actual labor and overhead
Maintenance plans are commonly priced by feel, not math. Top-quartile operators run maintenance plan economics that carry 30%+ standalone margin even after free service call inclusions and member discounts.
-
Adjust pricing against payroll cost annually
Wages rise 3–5% annually through tenure raises and market adjustments. If billable rates don't move in lockstep, you compress 4–7 net margin points over three years without noticing.
-
Optimize job mix toward higher-margin-per-hour work
If your service jobs run $173/hr profit and your install jobs run $114/hr, the dispatch and marketing decisions that grow your service book are mathematically more valuable than the ones that grow installs — even if installs feel bigger.
None of these require software you don't already have. The data lives in your field service management platform. The gap is configuration, reporting cadence, and discipline. For a deeper diagnostic on which of these are eroding your margin specifically, see why HVAC companies aren't profitable.
The Bottom Line on HVAC Profit Margin in 2026
The average HVAC profit margin in 2026 is approximately 5% net at the company level, with top-quartile operators running 15–20% net. The variance between operators is larger than the variance between segments — meaning what kind of HVAC work you do matters less than how disciplined your job costing, pricing, and dispatch decisions are.
For owners running below the median, the path to top-quartile margins is operational. The four levers — job-level visibility, fully-loaded labor, allocated overhead, and job-mix optimization — are accessible without new software, new hires, or major capital investment. They require the discipline to configure existing tools properly and the cadence to review them weekly.
For owners running near or above the median, the path to top-quartile margins is the same — implementation depth differs, but the levers are identical.
#HVAC Profit Margin FAQs
What is the average HVAC profit margin in 2026?
The average HVAC profit margin in 2026 is approximately 5% net at the company level for the median residential operator and 15–20% net for top-quartile contractors. Gross margin runs 42–48% for the median and 50–60% for top quartile. EBITDA margin runs 8–12% and 20–28% respectively. Margins vary materially by trade mix and shop size.
What is a good profit margin for an HVAC company?
A good profit margin for an HVAC company in 2026 is 15–20% net, 50%+ gross, and 20%+ EBITDA at the company level. These ranges define top-quartile performance. Net margin above 8% is meaningfully above the industry median. Sub-5% net margin indicates one or more operational issues — typically poor job costing, unmanaged callbacks, undercharged maintenance plans, or wage drift without pricing adjustments — actively eroding profitability.
Are HVAC companies profitable?
HVAC companies can be highly profitable, but with significant variance. The top quartile of HVAC contractors operates at 15–20% net margin while the median operator clears around 5%. Profitability is driven less by revenue scale and more by job-level economics: install vs. service mix, fully-loaded labor cost, callback rate, and overhead discipline. Many $2M HVAC shops are less profitable than $900K shops with stronger operating discipline.
What is a good gross margin for HVAC?
A good gross margin for HVAC in 2026 is 50%+ at the company level for top-quartile operators. Median residential HVAC contractors run 42–48% gross margin. Service-heavy residential shops typically achieve higher gross margins (50–58%) than install-heavy shops (38–46%) because labor productivity per dollar of revenue is higher and material content is lower as a percentage of price.
What is the EBITDA margin for HVAC companies?
EBITDA margin for HVAC companies in 2026 runs 8–12% for the median operator and 20–28% for top-quartile contractors. EBITDA matters most for valuation purposes. Private equity acquirers in the home services space typically pay 6–10x EBITDA for well-run residential HVAC contractors, meaning EBITDA quality directly determines what your business is worth if you ever sell it.
How does HVAC profit margin compare to other home service trades?
HVAC profit margins are similar to plumbing and electrical contractors at comparable revenue scale, with HVAC running slightly higher gross margin in service-heavy operations due to higher average ticket sizes. Multi-trade home service businesses (HVAC + plumbing + electrical) typically run 7–12% net margin — comparable to single-trade HVAC at the same revenue scale. The margin advantage of multi-trade is operational efficiency from shared overhead, not pricing power.
What HVAC profit margin do private equity acquirers look for?
Private equity acquirers in the residential HVAC space typically target businesses generating $1M+ in EBITDA with EBITDA margins of 15%+ and clean job-level financials. The premium multiples (8–10x+ EBITDA) go to businesses with auditable job costing, recurring maintenance plan revenue, low customer concentration, and management depth beyond the founder. EBITDA quality matters as much as EBITDA quantity.
How can I calculate my HVAC profit margin?
Calculate your gross profit margin as ((Revenue minus Cost of Goods Sold) divided by Revenue) times 100. COGS includes direct labor, materials, subcontractors, and equipment. Calculate net margin as (Net Income divided by Revenue) times 100, after all operating expenses, interest, and taxes. Calculate EBITDA margin by adding interest, taxes, depreciation, and amortization back to net income, then dividing by revenue. Normalize for owner compensation at market rate when comparing to industry benchmarks.
Where Do You Stand?
Get a Personalized HVAC Margin Benchmark
Answer 5 questions about your shop and we'll send a personalized benchmark — your numbers vs. similar HVAC operators in your segment, plus 1–2 specific suggestions for what to fix first. Tatenda reviews each one personally. Reply within one business day.
Move From Median to Top Quartile
Oryx Horn LLC builds custom job costing dashboards and financial analytics systems for HVAC, plumbing, and electrical contractors. If your current margin sits below the top-quartile benchmarks above and you want to know what it would take to close the gap, we can help — typically within 30 days.
Talk to an Analyst →