Free Resource
HVAC Job Costing Template: Free Download + 4 Ways to Improve Profit Per Job
Most HVAC companies think they are profitable — until they break it down per job. A contractor doing $1.8M in annual revenue recently shared their numbers with us. Monthly P&L looked healthy. But when we mapped profit to individual job types, 40% of their jobs were running below a 30% margin. They weren't unprofitable in aggregate. They were masking it in the average.
The HVAC job costing template below changes that. It gives you job-level visibility in under 10 minutes of data entry — so you can see exactly where margin is being made, lost, and left on the table.
#What This Template Does
This HVAC job costing template is not a generic spreadsheet. It's built around the four cost categories that matter in HVAC: direct labor (fully-loaded), materials, subcontractors, and allocated overhead. Enter your jobs and it calculates the metrics that tell the real story.
- Track true profit per job — revenue minus all four cost categories
- Identify your lowest-margin job types before you keep selling them
- Spot underperforming technicians by profit per hour, not just revenue
- Understand whether your margin leakage is in labor, materials, or overhead
- Compare install vs repair vs maintenance margins side by side
- Set margin floor targets and flag jobs that fall below them
#Template Preview
The HVAC job costing template includes two views: a job entry table where you log each job's revenue and cost breakdown, and a summary dashboard that auto-calculates your key metrics. Here's what you're working with:
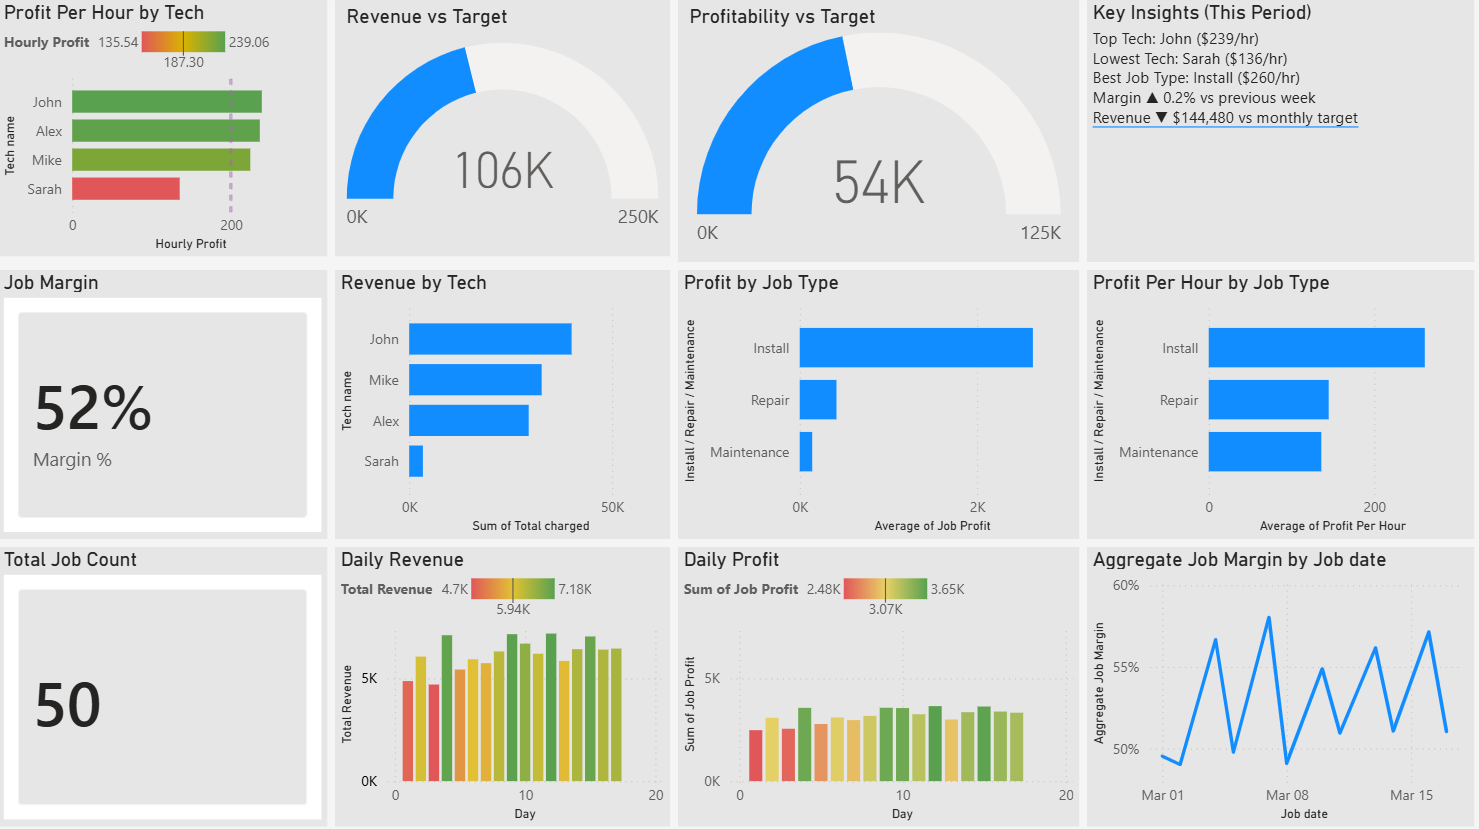
Dashboard tab: auto-calculated profit per hour by technician, margin by job type, and revenue vs target gauges.
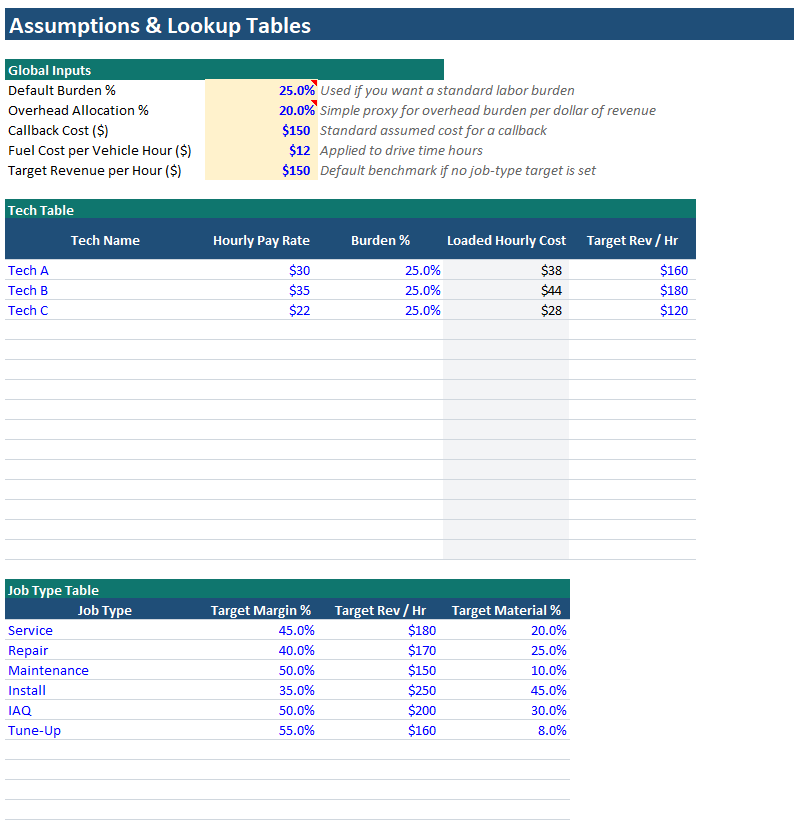
Job table tab: enter job date, type, technician, revenue, and each cost category. Everything else calculates automatically.
This HVAC job costing template implements the same framework we walk through in our HVAC Job Costing Complete Guide — putting the methodology directly into practice.
Download the Free HVAC Job Costing Template
Enter your name and work email — we'll send you the template and you can download it instantly. No spam. Unsubscribe anytime.
Used by HVAC contractors across the U.S. · No credit card required · Instant access
You're in — download your template below
We've also sent a copy to your inbox. If it doesn't arrive in 5 minutes, check your spam folder.
⬇ Download HVAC Job Costing Template (.xlsx)#How to Use the Template (3 Steps)
Setup takes under 10 minutes. Once your overhead rate and labor cost inputs are configured in the HVAC job costing template, ongoing use is just logging jobs as they close.
On the Settings tab, enter your fully-loaded labor rate per technician (wages + taxes + benefits + workers' comp) and your overhead allocation rate (total overhead ÷ annual billable hours). This is the foundation everything else calculates from. The IRS employment tax guide is a useful reference for calculating your full employer burden. If you're unsure of your fully-loaded rate, our job costing guide walks through the formula.
Log each completed job in the Job Table tab: date, job type (Install / Repair / Maintenance), technician name, total revenue charged, equipment and material costs, and technician hours. The template calculates labor cost, overhead allocation, job profit, margin %, and profit per hour automatically.
Switch to the Dashboard tab of your HVAC job costing template to see your key metrics: profit per hour by technician, margin by job type, daily revenue trend, and jobs below your margin floor. Review this every Monday before your team meeting. The patterns that surface in the first two weeks of use will change how you dispatch and price.
#Key Insights the Template Surfaces
Most contractors use the HVAC job costing template for three weeks and find at least one of the following. All three are common. Finding them is the point.
The template ranks every job by profit per hour. The bottom three are almost always the same job type or the same technician. That's your first intervention point.
Maintenance agreements frequently look like margin killers when overhead is properly allocated. Knowing this lets you price the next renewal correctly — or stop selling them at current rates.
A technician consistently below $150/hr profit is either pricing incorrectly, running too many callbacks, or being dispatched to the wrong job types. The data tells you which.
Is your margin compression coming from labor (understaffed jobs taking too long), materials (no markup discipline), or overhead (too many low-hour jobs)? The template isolates the source.
#3 Mistakes That Make Your Job Costing Data Wrong
The HVAC job costing template is only as accurate as your inputs. These three errors are the most common — and all of them make your margins look better than they are.
-
01
Ignoring Drive Time in Labor Hours
If a technician spends 45 minutes driving to a job and you log only the time on site, you are undercosting labor. Drive time is paid time. Include total time from dispatch to return in your labor hours input. This is especially punishing on service calls in outlying areas — a job that looks like it took 1.5 hours on site actually consumed 3 hours of technician capacity.
-
02
Not Logging Callbacks Against the Original Job
A callback is not a new job — it is a cost against the job that generated it. When you send a tech back to fix a first-visit error, that labor and vehicle cost should reduce the profit on the original ticket, not disappear into overhead. Tracking callbacks separately masks your true first-visit quality and overstates the margin on jobs that needed rework. For more on this, see our post on why HVAC companies aren't as profitable as they think.
-
03
Blending Install and Service Call Data
Install jobs carry higher material costs, more labor hours, and different overhead patterns than a 1-hour service call. If you aggregate them into a single job type, the averages obscure everything. A $240/hr install margin will mask a $90/hr service call margin in the blended number. Always keep job types separate — that separation is where the insight lives. Our guide on service call fee pricing covers how to think about the cost structure of diagnostic visits specifically.
Ready to Go Further?
Want This Automated Into a Live Dashboard?
The template gives you the framework. A connected ServiceTitan or Jobber dashboard gives you the same metrics updated in real time — no manual entry, no Monday morning data logging. Oryx Horn builds these systems for HVAC, plumbing, and electrical contractors typically within 30 days. The SBA's small business financial management guide is also worth bookmarking as you build your financial infrastructure.